|
|
|
|
|
|
|
|
|
|
Share-pricer is an easy-to-use, but flexible stock analysis tool. It performs fundamental analysis, not technical analysis of market movements. From the current and future state of the company, Share-pricer calculates fair value for the company share. It is also possible to compare what kind of expectations are present in the market prices of different companies
- easy comparison of companies
- automatic calculation of required growth
- uses essential fundamentals
- based on sound mathematical theory of Economic Profit
- handles the passing of time better than any Excel sheet you can make
- includes online help
- easy installer and uninstaller
- two language options: English and Finnish
To be able to correctly calculate the shareholders' equity in the future, we also need to know the dividend ratio (payout ratio) of the company. Also, for our purposes, the initial amount of equity is not needed, because it does not affect the share value. If company has high amount of equity, it's future earnings are valued exactly that much lower, and vice versa. This effect enables us to eliminate shareholders' equity from the inputs.
This leaves us with the following inputs:
- cost of equity
- dividend ratio
- future earnings estimates
Below is a picture of an analysis of a high tech company called "Company A".
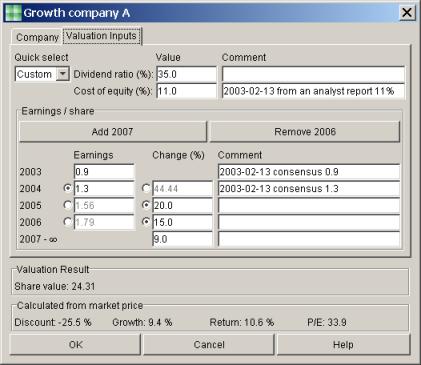 |
So the result was that share value is 24.67 (dollars, assuming that the earnings were given in dollars). Now we can input the current market price of the share. Based on that the program automatically calculates the P/E ratio, and the amount of long term growth that is required from the company for it to be worth the market price (Required growth).
Pressing OK brings us back to the main window. There we can easily compare the companies. By clicking the table headers, the companies can be sorted based on the following criteria:
- A user defined order that can be used, for example, to enter the latest market prices
- Alphabetically by name
- Discount (how much cheaper is the market price than the estimated value)
- P/E ratio
- Required growth, a very powerful figure that takes into account all the most important fundamentals of the company
- Modification dates of analysis or market price
Here is an example of how to quickly find buying opportunities even if you have not updated your data for a while:
Below is a picture of the main window:
 |
Share-Pricer
 $29.90
 ![]() Secure Payment Options
Secure Payment Options
Special ! Free Choice of Complete Excel Training Course OR Excel Add-ins Collection on all purchases totaling over $70.00. ALL purchases totaling over $150.00 gets you BOTH! Purchases MUST be made via this site. Send payment proof to [email protected] 31 days after purchase date.
Instant Download and Money Back Guarantee on Most Software
Excel Trader Package Technical Analysis in Excel With $139.00 of FREE software!
Microsoft � and Microsoft Excel � are registered trademarks of Microsoft Corporation. OzGrid is in no way associated with Microsoft
Some of our more popular products are below...
Convert Excel Spreadsheets To Webpages | Trading In Excel | Construction Estimators | Finance Templates & Add-ins Bundle | Code-VBA | Smart-VBA | Print-VBA | Excel Data Manipulation & Analysis | Convert MS Office Applications To...... | Analyzer Excel | Downloader Excel
| MSSQL Migration
Toolkit |
Monte Carlo Add-in |
Excel
Costing Templates