|
|
|
|
Below are many examples that can be used to create Excel charts with a difference. The Excel charting pages listed here show many different charting techniques, examples and solutions. All Excel charts are the brain-child of Andy Pope who is a regular poster on our FREE Excel Help forum. He is also a well deserved Microsoft Most Valuable Person (MVP)
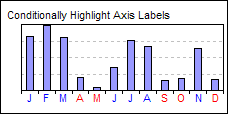
Conditional Highlighting Axis Labels : The Excel chart on this page highlights the X axis category labels when the monthly data drops below 25.
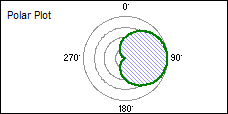
Polar Plot Charts : The polar plot is created using the Radar chart. This particular example requires 2 data series in order to generate the spiral effect.
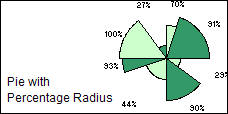
Pie Chart With Individual Slice Radius : Chart is a filled radar chart with multiple series.
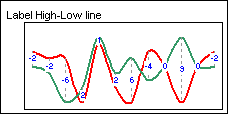
Label High-low Line With Values : Uses an additional data series plotted on the secondary axis to add values to the high-low lines.
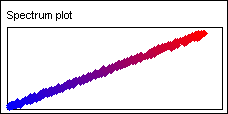
XY Scatter Colouration Plot : The chart in both cases is a standard xy scatter plot where the plot order of each data point determines the colour of the marker.
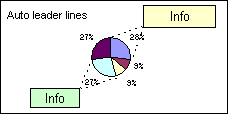
Custom Leader Lines : This chart has 2 textboxes for displaying information regarding the 1st and 4th slice.
>> Excel Charting Page 2
Excel Dashboard Reports & Excel Dashboard Charts 50% Off Become an ExcelUser Affiliate & Earn Money
Special! Free Choice of Complete Excel Training Course OR Excel Add-ins Collection on all purchases totaling over $64.00. ALL purchases totaling over $150.00 gets you BOTH! Purchases MUST be made via this site. Send payment proof to [email protected] 31 days after purchase date.
Instant Download and Money Back Guarantee on Most Software
Excel Trader Package Technical Analysis in Excel With $139.00 of FREE software!
Microsoft � and Microsoft Excel � are registered trademarks of Microsoft Corporation. OzGrid is in no way associated with Microsoft
Some of our more popular products are below...
Convert Excel Spreadsheets To Webpages | Trading In Excel | Construction Estimators | Finance Templates & Add-ins Bundle | Code-VBA | Smart-VBA | Print-VBA | Excel Data Manipulation & Analysis | Convert MS Office Applications To...... | Analyzer Excel | Downloader Excel
| MSSQL Migration
Toolkit |
Monte Carlo Add-in |
Excel
Costing Templates