| <<Convert Excel Spreadsheets to Web Pages | Trading Software That Operates Within Excel | Convert Excel, Access & Other Databases | Merge Excel Files>> |
|---|
|
Table of ContentsStep 1: Prepare the Data for a PivotTable Report Step 2: Create a PivotTable Report Step 3: Customize a PivotTable Report Step 4: Print a PivotTable Report
|
Step 2: Create a PivotTable Report| | Information Helpful? Why Not Donate.TRY OUT: Smart-VBA | Code-VBA | Analyzer-XL | Downloader-XL | Trader-XL| More Free Downloads.. Best Value: Finance Templates Bundle
To create a PivotTable report, you first use
the PivotTable and PivotChart Wizard to specify the data you want to use
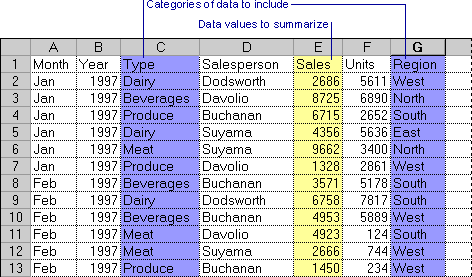
and to create the report framework. You can then use the PivotTable toolbar to arrange the data within that framework. For example, you can choose the categories of data to
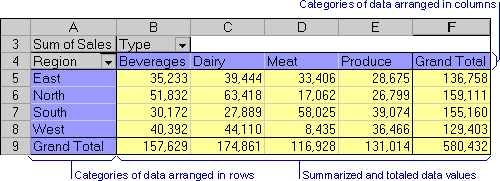
include and the corresponding data values to summarize. Then, tell Microsoft® Excel how to arrange the
data categories in the rows and columns of the PivotTable report. When
Excel creates the finished report, it automatically summarizes and totals
the data values. Start by using the
PivotTable and PivotChart wizard 1.
Open the workbook where you want to create the PivotTable report. If
you're basing the report on an Excel list or database, click a cell in the
list or database. 2.
On the Data menu, click PivotTable
and PivotChart Report. 3.
In step 1 of the PivotTable and PivotChart Wizard, follow the
instructions, and click PivotTable
under What kind of report do you
want to create? 4.
Follow the instructions in step 2 of the wizard. If
you're retrieving external data for the PivotTable report, you can get
more information about using Microsoft Query or the Query Wizard. Just
type ways to retrieve data from an
external database in the Office Assistant or on the Answer Wizard tab in the Excel Help window, and then click Search. 5.
In step 3 of the wizard, click Finish. Lay out the PivotTable report 1.
On the PivotTable
toolbar, drag field buttons to the labeled areas on the PivotTable
diagram. Note
To see a demonstration of how to drag the field buttons, click the Start
button: 2.
If you want to rearrange the fields, drag them from one area to
another. To remove a field, drag it outside the PivotTable report. Notes ·
In some cases, you might not want to lay out the PivotTable
report directly on a worksheet. For example, if your data source is a
large external database, worksheet layout may be too time consuming. In
this case, you can click Layout
in step 3 of the PivotTable and PivotChart Wizard to lay out the
PivotTable report. (For more information about laying out a PivotTable
report, type PivotTable Wizard
Layout dialog box in the Office Assistant or on the Answer
Wizard tab in the Excel Help window, and then click Search.) ·
For details on laying out a PivotTable report that uses OLAP
source data, type lay out a
PivotTable in the Office Assistant or on the Answer Wizard tab in the Excel Help window, and then click Search. Anatomy of a PivotTable Report
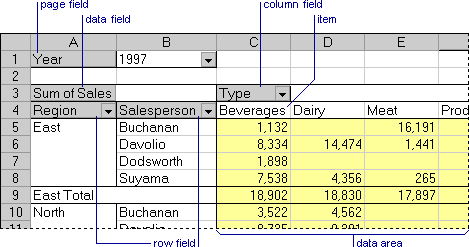
You may have noticed that Excel uses specific terms to
identify the parts of a PivotTable report. If you're not familiar with
these terms, read this section for a quick primer. |