|
|
|
|
Current Special! Complete Excel
Excel
Training Course
for Excel 97 - Excel 2003, only $145.00.
$59.95 Instant
Buy/Download,
30 Day Money Back Guarantee & Free
Excel Help for LIFE!
Got any Excel Questions? Free Excel Help
Excel Subtotals. See Also: Excel Table Tools comes with FREE software
See Also:
Excel Subtotals ||
Making the
SUBTOTAL Function Dynamic
||
Bold Excel Subtotals Automatically
||
Sum Every
Nth Cell
|| Count
of Each Item in a List
||
Excel Pivot
Tables
In Excel we can use the Subtotals feature found under
Data on
the Worksheet Menu Bar to Subtotal a table of data. When doing so it
is imperative that the table of data is sorted by the column you wish to
Subtotal ("at each change in"). The Subtotal can be in the form of
COUNT, COUNT NUMS SUM, AVERAGE, MIN, MAX, PRODUCT, STDDEV, STDDEVP, VAR or
VARP. Let's use the table below to apply subtotals so we can get a count by
"Description".
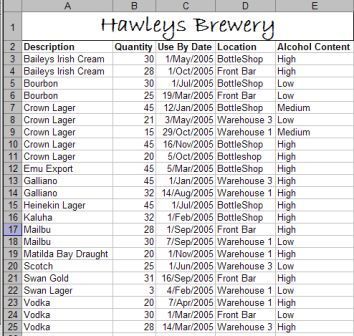
As you can see, the table has
been sorted by the "Description" column. This is required if we wish to use
the "Description" column to get a Subtotal count. It is important to note
that Count in this case is not a count of only numbers like the COUNT Worksheet Function. For that, we would use Count Nums.
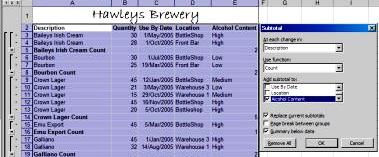
The picture below now shows us what it looks like after applying Subtotals
and also the settings we have used.
Let's now say we wanted to do a Subtotal by Month using the "Use By Date" dates . To achieve this we would need to add/use an extra column, which can hide if preferred, and have a formula that changes number and each change in month. The other thing we would need to do is sort the table by the "Use By Date" column. The formula we would use in an extra column, say "F" would be as shown below;
=MONTH(C3)
We would copy this down to the last row that has a date in "Use By Date". If F2 we could use the heading "Month". This would then give us a column of numbers that only change when the month in the referenced "Use By Date" column changes. We would then simply apply Subtotals as shown above using the "Months" column. Note that in this case, as the table has been sorted by "Use By Date" we do not need to re-sort the table by "Month". We could, but the result would be exactly the same.
Excel Dashboard Reports & Excel Dashboard Charts 50% Off Become an ExcelUser Affiliate & Earn Money
Special! Free Choice of Complete Excel Training Course OR Excel Add-ins Collection on all purchases totaling over $64.00. ALL purchases totaling over $150.00 gets you BOTH! Purchases MUST be made via this site. Send payment proof to [email protected] 31 days after purchase date.
Instant Download and Money Back Guarantee on Most Software
Excel Trader Package Technical Analysis in Excel With $139.00 of FREE software!
Microsoft � and Microsoft Excel � are registered trademarks of Microsoft Corporation. OzGrid is in no way associated with Microsoft
Some of our more popular products are below...
Convert Excel Spreadsheets To Webpages | Trading In Excel | Construction Estimators | Finance Templates & Add-ins Bundle | Code-VBA | Smart-VBA | Print-VBA | Excel Data Manipulation & Analysis | Convert MS Office Applications To...... | Analyzer Excel | Downloader Excel
| MSSQL Migration
Toolkit |
Monte Carlo Add-in |
Excel
Costing Templates