|
|
|
|
Back to Excel Charts Page 1
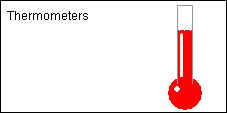
Excel Thermometer Charts : Thermometer style charts in Excel
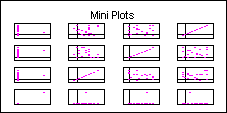
Mini XY Scatter Plots : Matrix of mini xy scatter plots.
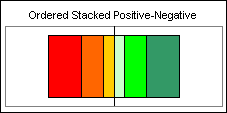
Stacked Positive/Negative Bar : Stacked positive and negative bar chart with series order maintained.
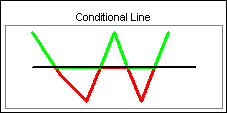
Conditional Line Chart : Change the color of a line as it passes above or below a fixed datum line.
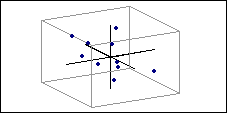
3d XY-Scatter Chart : Simulated 3d XY scatter.
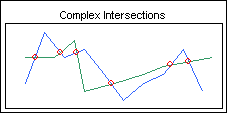
Complex Intersections : Mark the points of intersection between two lines.
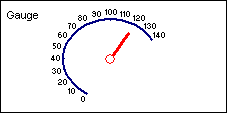
Excel Gauge Chart : A speedo style chart.
<< Excel Charts Page 6
Back to Excel Charts Page 1
Excel Dashboard Reports & Excel Dashboard Charts 50% Off Become an ExcelUser Affiliate & Earn Money
Special! Free Choice of Complete Excel Training Course OR Excel Add-ins Collection on all purchases totaling over $64.00. ALL purchases totaling over $150.00 gets you BOTH! Purchases MUST be made via this site. Send payment proof to [email protected] 31 days after purchase date.
Instant Download and Money Back Guarantee on Most Software
Excel Trader Package Technical Analysis in Excel With $139.00 of FREE software!
Microsoft � and Microsoft Excel � are registered trademarks of Microsoft Corporation. OzGrid is in no way associated with Microsoft
Some of our more popular products are below...
Convert Excel Spreadsheets To Webpages | Trading In Excel | Construction Estimators | Finance Templates & Add-ins Bundle | Code-VBA | Smart-VBA | Print-VBA | Excel Data Manipulation & Analysis | Convert MS Office Applications To...... | Analyzer Excel | Downloader Excel
| MSSQL Migration
Toolkit |
Monte Carlo Add-in |
Excel
Costing Templates