|
|
|
|
Current Special! Complete
Excel Excel Training
Course for Excel 97 - Excel 2003, only $145.00. $59.95 Instant
Buy/Download, 30 Day Money Back Guarantee
& Free Excel Help for LIFE!
Excel's VLookup Function. See Also: Excel VLOOKUP || Calculate Sliding Scale Tax || Left Lookup in Excel Excel
The VLookup Function can be used to look for numeric values in lists and tables and to use those values in a calculation. A perfect example of how VLookup can be used to glean information is to work out how much tax you are required to pay. To do this, we must find an appropriate tax rate based on an annual salary and take into consideration the number of dependents.
Ideally, one should use Dynamic Named Ranges for Lookup tables. However, for easier reading we have used range addresses here.
Consider the following table:
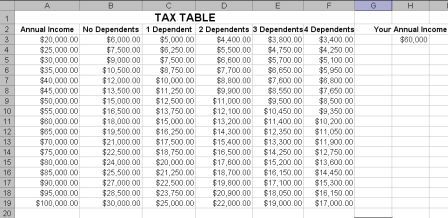
VLookup generally requires three arguments (lookup_value,table_array,col_index_num). The lookup value is the annual income, the table array is the address or location of the Tax Table above (A3:F19) and the column index number is the relevant column applying; No Dependents, 1 Dependent, 2 Dependents etc.
Let's say that we earn $60,000 per year, and we have no Dependents. The VLookup function to work out the tax payable is written as =VLOOKUP(H3,A3:F19,2) and will return a value of $18,000. This is because VLookup scans down the first column looking for the lookup value ($60,000) in the table, then returns the value in column 2 of the table on the same row ($18,000). This is because the exact amount of $60,000 exists under Annual Income.
When There is no Exact Match
Let's look at another example. This time, let's say we earn $43,000 per year and we have 3 Dependents. The Function is written in the same way =VLOOKUP(H3,A3:F19,5). However as $43,000 cannot be found in the first column of the Tax Table, VLookup will step back to the closest value, so it scans down the first column looking for the lookup value ($43,000) in the table, it can't find it, so it steps back to the closest value. In this case $40,000. It then returns the value in column 5 of the table in the same row ($7,600).
To see details on this see: VLookup here.
Using VLookup to work out Commission Due
You can also easily use this type of VLookup in a formula. Let's say you wanted to work out how much money was due to you, when your earnings were worked out as a percentage of sales:
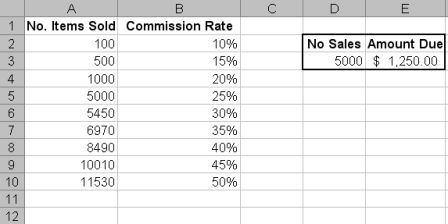
You would write the formula as =D3*VLOOKUP(D3,$A$2:$B$10,2). If your sales are 5000, then the commission due will be $1,125.00. This is because 5000 is multiplied by the result of the VLookup. VLookup scans down the first column until it locates 5000, then returns the value in column 2 on the same row.
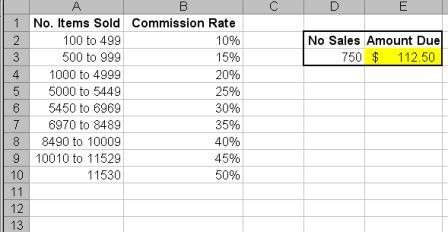
If your sales are 750, then the commission due will be $112.50. This is because 750 is multiplied by the result of the VLookup. In this case the VLookup cannot find 750 when it scans down the first column of the table. It steps back to the closest value, 500 and returns the value in the second column on the same row, 15%. So in effect our formula is taking the amount of sales, 750 and multiplying it by 15%, the amount of commission due.
Tip
A great way to display values to make your table easier to read and understand when you wish to use VLookup would be to format your cells with a custom format of "100 to 499" in cell A2, "500 to 999" in A3 etc, so your values display like in the following table. It is important to note that these are only displayed values and the true underlying value is still the same as shown in A2:A10 in the table above.
Click here to go to Using VLookup with a Lookup Table
Excel Dashboard Reports & Excel Dashboard Charts 50% Off Become an ExcelUser Affiliate & Earn Money
Special! Free Choice of Complete Excel Training Course OR Excel Add-ins Collection on all purchases totaling over $64.00. ALL purchases totaling over $150.00 gets you BOTH! Purchases MUST be made via this site. Send payment proof to [email protected] 31 days after purchase date.
Instant Download and Money Back Guarantee on Most Software
Excel Trader Package Technical Analysis in Excel With $139.00 of FREE software!

Microsoft � and Microsoft Excel � are registered trademarks of Microsoft Corporation. OzGrid is in no way associated with Microsoft
Some of our more popular products are below...
Convert Excel Spreadsheets To Webpages | Trading In Excel | Construction Estimators | Finance Templates & Add-ins Bundle | Code-VBA | Smart-VBA | Print-VBA | Excel Data Manipulation & Analysis | Convert MS Office Applications To...... | Analyzer Excel | Downloader Excel
| MSSQL Migration
Toolkit |
Monte Carlo Add-in |
Excel
Costing Templates
FREE Excel Help