| |
|
|
| |
|
|
|
|
Dashboard Kit  Risk free with a ONE FULL YEAR money-back guarantee for
$114.70 only $49.95. Discounts Or, sell this popular product and get paid.
Special! Free Choice of Complete Excel Training Course OR Excel Add-ins Collection on all purchases. ALL purchases totaling over $150.00 gets you BOTH! Purchases MUST be made via this site. Send payment proof to [email protected]
Excel Dashboard reports are easier to read than are Excel reports with many pages of numbers. But what few people realize is that Excel makes great dashboard reports. This book shows you how! Risk Free ONE FULL YEAR Money Back Guarantee! FREE revisions. When we revise the kit, we'll send it absolutely free to current owners. When we update the kit with new material for Excel 12, we'll offer it to owners for a substantial discount.
On This Page: An Overview of the Book || Working Dashboard || Dashboard Data || Traffic Lights || New Color Schemes ||Shrinking Charts || Synchronized Charting ||Create Magazine-Quality Charts || Print Portrait and Landscape Together || Special Bonus! || There's Even More! || Here's What You Get || We already own expensive dashboard software, so why do we also need Excel dashboards? || Bulk Buy Discounts || FREE Software | Watch Demo Video | Buy Now
Excel Dashboard Reports: An Overview of the Book Back to Top
The book's first few chapters explain how to set up the building blocks: small charts, Camera Tool objects, colors, workbook structure, and so on.
The middle chapters explain how to link your report to a spreadsheet database, how to update your report easily, and how to trap errors in your report.
The ending chapters explain how to create a dashboard from scratch, and they provide many Excel charting and design examples.
Excel Reports: Working Excel Dashboard Reports Back to Top
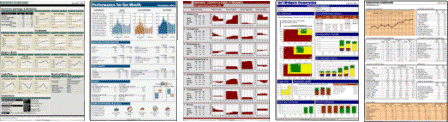
The first dashboard below is our most popular dashboard workbook. We normally sell it for $44.95. But it's included free with the Excel Dashboard Kit. The other images illustrate the wide variety of dashboard reports you can create using the techniques described in the book.
The report normally is printed in color. But it looks great when printed in black-and-white on a standard laser printer.
Excel Reports: Dashboard Data Back to Top
To change the dashboard above from one company or division to another, you merely link it to a new workbook database. Others sells databases for public companies for $9.95 each. The Excel Dashboard Kit includes actual data for Microsoft and Wal-Mart free.
You can use this report for your own company. You merely copy one of these database workbooks, enter your financial data, link the dashboard to that workbook, and then recalculate Excel. It's easy.
Excel Reports: Traffic Lights Back to Top
These figures illustrate three views of one traffic light, which works with a live chart. Excel automatically displays whichever view applies. The process is easy. No macros are needed.
Excel Reports: New Color Schemes Back to Top  Did you know that you're not limited to Excel's default colors? As this palette illustrates, you can display any color you want in Excel.
The kit shows you how to do it, and includes a workbook with this color scheme.
Of course, you can create your own traffic lights. The kit includes a workbook with these traffic lights, and shows you how to create them.
Excel Reports: Shrinking Charts Back to Top
To make your charts smaller you must find ways to make them narrower...without making your fonts microscopic.
One useful trick is to display date labels in two rows beneath your chart, with the month above the year. Excel offers two methods for doing this. One works much better than the other. The book explains both methods and explains why one is preferred.
Excel Reports: Synchronized ChartingBack to Top
Everyone knows that Excel charts are independent of each other. Excel charts can't be made to work in sync.
Well, that's not exactly true...
This Excel dashboard compares key metrics for seven different companies. Each column of charts uses the same dynamically calculated Y-axis settings. This allows readers to visually compare each company�s performance within each column. (Click the image to see it in full size.)
Excel Reports: Create Magazine-Quality Charts Back to Top
Is this figure from Excel or Business Week?
It's both, actually. The figure is from Excel and exactly duplicates the look and feel of a BW figure. The book explains how it's done. And the kit includes this working chart.
Excel Reports: Print Portrait and Landscape Together Back to Top
When a figure in a portrait-mode report is too wide to print in portrait, most people print it in landscape mode. But doing so also prints headers and footers in landscape mode, making them difficult to read in a standard portrait report. However, you can print headers and footers in portrait and figures in landscape. The book explains how.
The book also explains how to print both a portrait and a landscape figure on the same page at the same time, which gives you the ability to create Mini Briefing Books.
Excel Reports: Special Bonus! Back to Top
After the book was completed, I created a report with 110 charts on one printed page. Because each figure is slightly smaller than a postage stamp, I called it a Stamp Report. (Click here to see thefull report .)
This format offers an easy way for managers to monitor monthly changes by GL account, sales by product, purchases by customer, and so on.
The Excel Dashboard Kit includes this workbook as a special bonus. The workbook includes a fully commented macro that builds the report using the first figure in the report as a pattern.
Excel Reports: There's Even More!Back to Top
I've only discussed a small part of the information that Dashboard Reporting With Excel contains. To illustrate, here's additional information about charts that you'll find in the book:
How to shrink Y-axis labels without reducing the font size.
The easiest way to add a data series to a chart.
How to set up multiple chart types in one chart.
How to set up a chart's Secondary Value Axis.
How and why to use overlaid charts.
How to set up dynamic text boxes in charts.
How to display unit-of-measure text boxes in charts.
How to create figures that are more useful than gauges.
How to manage many charts in a worksheet.
How to set up several charts to use the same X axes and Y axes.
Etc.
And here are even more topics you'll find in the book:
How to use INDEX-MATCH formulas and range names to return data from spreadsheet databases.
How to display adjacent tables that use different column widths and row heights.
How to create and print Mini-Briefing Books...stapled reports that are small enough to fit in your shirt pocket.
How to add dynamic lists to your reports, lists that automatically expand and contract as the amount of data changes.
How to update your dashboard report in seconds each period and avoid Spreadsheet Hell.
How to error-check your spreadsheet reports...automatically.
Etc.
Excel Reports: Here's What You Get: Back to Top
Here's what you get with the Excel Dashboard Kit:
My 150-page e-book, Dashboard Reporting With Excel.
The files created for the book. These include:
> the dashboard report that the book shows you how to create,
> four Excel database workbooks for the dashboard report,
> the traffic light workbook, and,
> the six Excel workbooks with magazine-quality displays.
The full-page beige-and-green "Working Dashboard" shown above, which includes a workbook database with artificial data.
Two workbook databases, which contain actual performance information for Microsoft and Wal-Mart.
An Excel workbook that uses the Excel User color scheme.
The special Postage Stamp report that can display 110 charts on one printed page. It includes a well-documented macro that populates the page.
We already own expensive dashboard software, so why do we also need Excel dashboards?" Back toTop
I can think of at least five reasons you'll find the Excel dashboard kit valuable even if your company uses other dashboard products:
1. The dashboard kit shows you how to create and modify high-quality dashboards yourself...and do so quickly. With expensive dashboard software you often must wait for programmers and other experts to do the work. Excel dashboards put Excel users in control.
2. One Excel dashboard report can present data from any number of sources...from both inside and outside your company. Your expensive dashboard reports probably are chained to an internal database controlled by the IT Department.
3. Excel dashboards are particularly well-suited for printing reports. Your expensive dashboards probably are designed for reporting online.
4. Dashboard techniques can improve your other Excel reports. The techniques can make those reports easier to update, and easier to read.
5. Dashboards that can't check for errors can give you bad data with a pretty face...a result that managers don't appreciate. Excel offers more power to find errors in your data and reports than does any other dashboard program.
In short, the Excel Dashboard Kit provides many valuable resources, whether your company uses other dashboard software or not.
That about wraps things up...
Act NOW - because this is the best offer that I've ever made for Excel user, and I don't expect it to continue for very long.
Read More About Excel Dashboard Kit: Excel Dashboard Reports Example |Sales Variance By Product |Customer Reviews
Dashboard Kit Risk free with a ONE FULL YEAR money-back guarantee for$114.70 only $49.95
| Your order will be delivered immediately in one Zip file for each product ordered. We accept Visa, Mastercard, American Express, and Discover. If you don't already have Adobe Acrobat PDF Reader, you can download a FREE copy here. You'll probably use it a lot. To open the Zipped version, you'll need to install a program like WinZip. You can download a free copy here. If you have any problems downloading or un-zipping the files,contact me immediately. I'll make sure to get you what you need. If you have questions about the e-book or spreadsheet examples, I'll make every effort to answer your questions in a timely manner. | Bulk Buy Discounts | |
|---|---|---|
| Units | Discount | |
| 2-5 | 20% | |
| 6-9 | 30% | |
| 10-299 | 40% | |
| 300-499 | 50% | |
| 500+ | 55% | |
Special! Free Choice of Complete Excel Training Course OR Excel Add-ins Collection on all purchases totaling over $70.00. ALL purchases totaling over $150.00 gets you BOTH! Purchases MUST be made via this site. Send payment proof to [email protected] 31 days after purchase date.
See Also:Excel Add-ons. Over 200!
Instant Download and Money Back Guarantee on Most Software
Excel Trader PackageTechnical Analysis in Excel With $139.00 of FREE software!
Microsoft � and Microsoft Excel � are registered trademarks of Microsoft Corporation. OzGrid is in no way associated with Microsoft