Personal & Business Software .
For Free 24/7 Microsoft Office ® Support See:
Our Free Excel & VBA Help Forum. See Also our: Free Excel Newsletter
![]() Microsoft Excel ® Templates, Training & Add-ins.
Microsoft Excel ® Templates, Training & Add-ins.
Personal & Business Software .
For Free 24/7 Microsoft Office ® Support See:
Our Free Excel & VBA Help Forum. See Also our: Free Excel Newsletter
What's New at OzGrid | Excel Tips and Tricks | Excel VBA Tips and Tricks | Main Software Categories |Newsletter Archives
As we enter into the month of February, we have had a big boost to our egos. We received the second royalty cheque for our book 100 Industrial Strength Excel Tips and Tools and sales have nearly doubled. This was no doubt in part to the excellent review we received from Amazon (click here to read it) who placed us at No. 1 for their Editors Pick of Computer Books for 2004. We are very pleased with this result, and hope for continued increasing sales in the months to come.
We have just purchased new computers for our business as with the growth of the business and the amount of time and information required, this became a necessity. Dave has the newest, greatest lap-top and is at present investigating the joys of a “wireless network” so he can lie in his hammock in the back yard and work. Tough life.
As you will see below we have a guest writer this week who's excellent and Open SourceFinance and Statistics Models we are now selling via our site. I think you find these products some of, if not the, best prices around!
Finally, with the huge human toll of the tsunami being readily apparent, and the massive devastation left in it’s wake, we would like to give a pat on the back all OzGrid visitors who donated in any way, big or small to this terrible tragedy
This month I have invited a guest writer, Anthony Sun. I chose him after him contacting Ozgrid about selling his products. After seeing and trying his products I was very impressed indeed! Then, when he told me the price he was charging for these product AND the fact they were less than $15.00 and they are Open Source, I was further impressed. As a result of this I have added his products to our very extensiveExcel Add-ins list. His products are open source Finance and Statistics Models. See links below;Random Numbers Generator and Statistics ||Numerical Searching Methods and Option Pricing Models ||Finance and Statistics Models I feel sure that these prices will not stay this low for long, but that of course is Anthony's call.Ok, so what has Anthony written for Ozgrid?Creating Frequency Distribution (Histogram)
A histogram is a bar (or column) chart. It is often used in statistical simulations to show the graphical representation of a probability distribution. In order to generate a histogram, one must need to have a frequency distribution. Frequency distribution shows how often values occur within a range of values. For example, the number of test scores that fall within ranges of scores as shown below:
| Scores | Number of Students |
| 0 to 60 | 11 |
| 61 to 70 | 34 |
| 71 to 80 | 29 |
| 81 to 90 | 19 |
| 91 to 100 | 7 |
In this section, we will show you two ways to generate frequency distribution; with Excel array function, FREQUENCY(), and with VBA. In this example, we will demonstrate on how to generate frequency distribution using both methods.
Excel uses an array function, FREQUENCY(), to generate frequency distribution. FREQUENCY calculates how often values occur within a range of values, and then returns a vertical array of numbers. Since FREQUENCY returns an array, it must be entered as an array formula.
FREQUENCY function has two arguments, (data_array and bins_array). Taken from Excel Help, Data_array is an array of or reference to a set of values for which you want to count frequencies. Bins_array is an array of or reference to intervals into which you want to group the values in data_array.
The following is a step by step example on how to use the FREQUENCY function to generate a frequency distribution using the given data below.
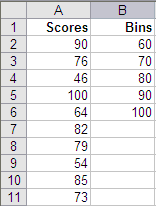
Step 1. Since the FREQUENCY function is an array function, it must be entered as an array formula. So first, select cells C2 to C6 (or any other range on the worksheet that contains 5 consequent cells).
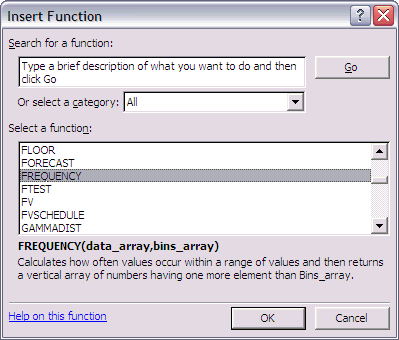
Step 1. Bring up the Excel function wizard from Insert...Function
Step 2. Select the FREQUENCY function under either All or the Statistical category.
Step 3. In the Function Arguments, enter the scores range, A2:A11 for the Data_array and B2:B6 for the Bin_array.
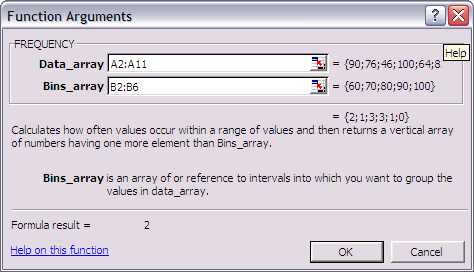
Step 4. After assigning the argument values, press CTRL+SHIFT+ENTER. The result is shown as followed:
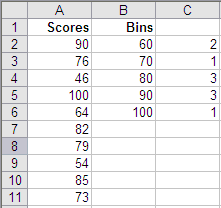
As the result indicated, 2 students got scores below or equal to 60, 1 got between 61 and 70 and so on. If the formula is not entered by pressing CTRL+SHIFT+ENTER, cell C2 will return 1.
This a follow on from the above Excel tips and again written by Anthony Sun. Who's products can been seen and bought via the links below;
Random Numbers Generator and Statistics ||Numerical Searching Methods and Option Pricing Models ||Finance and Statistics Models
Remember, these products are all Open Source and priced to sell.
The following sub procedure is a model for generating a histogram. The first parameter, M, is the number of bins (breaks) that you want to have for the histogram. The second parameter is the array that contains that values for the histogram.
In order for this procedure to work properly, the array needs to be sorted for calling the histogram procedure (in this example, the array is assume to be sorted). This way, the maximum and the minimum values can be derived and used for setting up the bin values and the linear interpolation can be used to get each of the bins.
Here is the code that generates a frequency distribution:
The array used in this example contains random numbers generated from a standard normal probability distribution. The following is a simple output generated from the sub procedure:
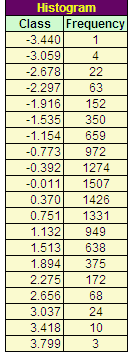
The class is the bins or the breaks. The frequency contains the number of simulated values for each of the classes.
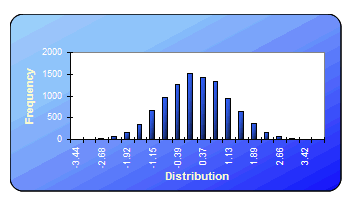
Here is a histogram chart generated from the frequency distribution above:
Until next month, keep Excelling!
Microsoft Excel ® Add-ins | Microsoft Excel ® Training & Tutoring | Microsoft Excel ® Templates | Excel, Word, Access Password Recovery | Corrupt Excel, Word, Access File Recovery | Financial Software | Financial Calculators | Conversion Software | Construction & Estimating Software | Real Estate Investment Software | Time & Project Management Software | Database Software Neural Network Software | Trading Software | Charting Software Windows & Internet Software | Barcodes, Fonts, ActiveX, Labels and DLL's
Microsoft ® and Microsoft Excel ® are registered trademarks of Microsoft Corporation. OzGrid is in no way associated with Microsoft.
Contact Us